Moodle Heatmap block
The Heatmap block provides educators with a colour-coded overlay of interaction statistics that can be toggled off and on in the site. A count of total interactions and unique users is displayed for each activity and resource in the site.
Why?
By providing a colour-coded overlay of interaction statistics, the Heatmap block allows you to identify patterns in student engagement with your site quickly and easily.
The insights gleaned from the Heatmap block can prompt meaningful reflection on your site design. For instance, you might find that a certain activity attracts more views than expected. This could be an indicator that students find this material particularly helpful or challenging. If it's a support resource, perhaps it could be more seamlessly integrated into the lessons. If it's an activity, maybe there's a preference for its modality that can be applied to other parts of the course.
On the other hand, if an activity or resource has fewer views than expected, several questions arise. Is it visible to students? Is it placed logically within the site? Does it have a clear, descriptive name? Is it timely and does this align with student understanding? The answers to these questions could lead to actionable improvements in your site design.
The Heatmap block can also be a valuable tool in planning proactive communications. For example, if you notice a key resource related to an upcoming assessment is being underutilised, you might send out an announcement to bring it to the students' attention.
Furthermore, the Heatmap block can inform future site design by highlighting activities or resources that receive little to no interaction. This data can guide decisions to remove, reorder, or redesign certain elements for the next course iteration.
How?
Adding the Heatmap block
- Ensure Edit mode is on.
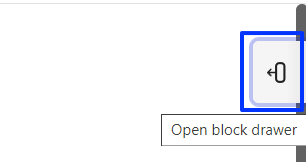
- Click the Open block drawer button if the block drawer is not already displayed.
- Click the Add a block button at the top of the block drawer.
- From the Add a block list, select Heatmap to add it. A new Heatmap block will now be visible in the block drawer.
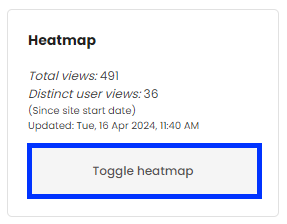
- Select Toggle heatmap to turn off and on as needed.
Note: If a user with Site Coordinator or Teaching Staff access turns on the Heatmap, it displays to all users with those roles. Only that user can turn it off for everyone. Other users with Site Coordinator or Teaching Staff access can only turn off the heatmap display for themselves.
The Heatmap block includes summary statistics on total views (any kind of interaction) and distinct users since the subject site start date. An example section is displayed below. 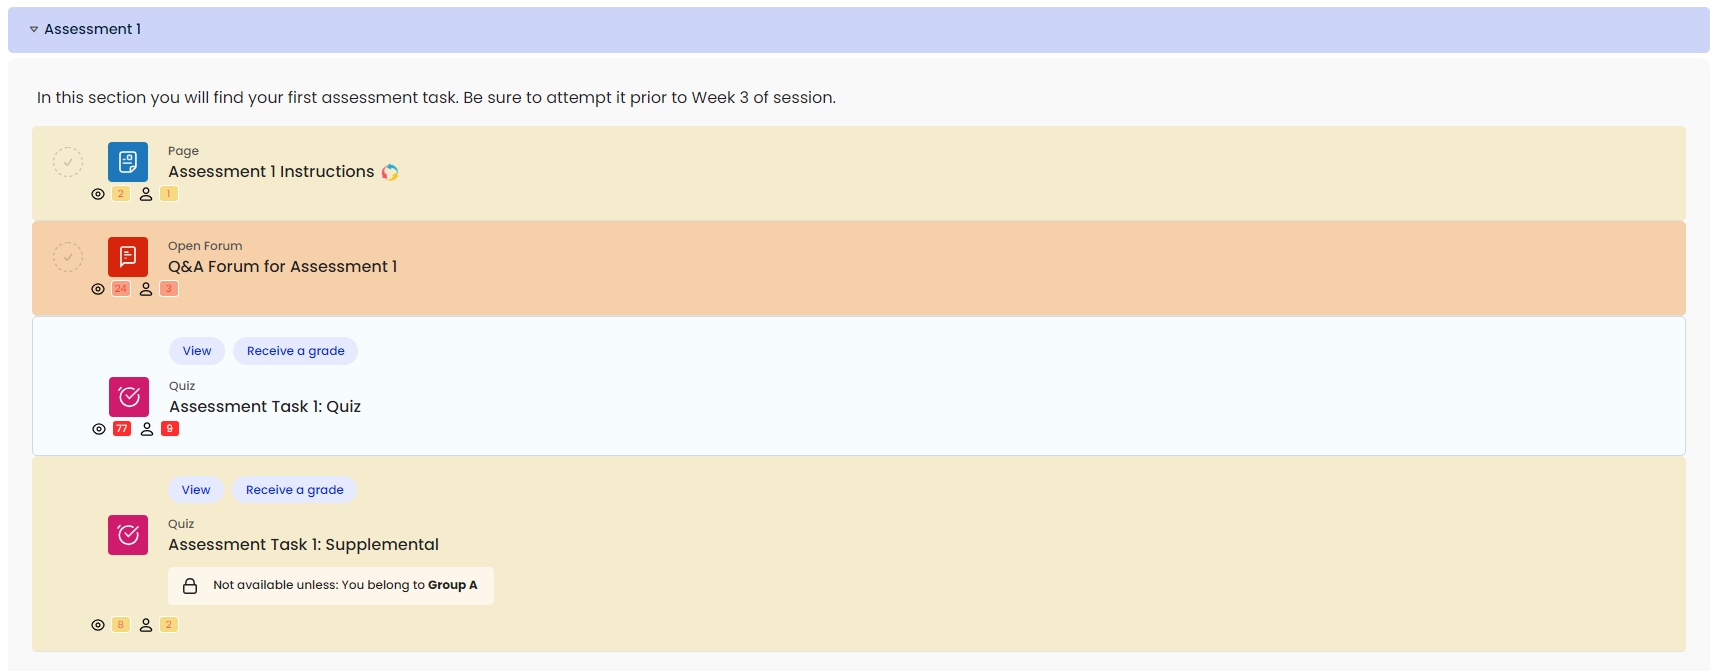
Interpreting the data
The Heatmap block provides information to educators through:
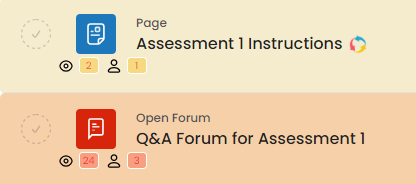
- Coloured backgrounds for each activity and resource. Colours range from red (most active), orange (moderate activity), through to yellow (low activity). Activities with no interactions will not display a coloured background.
- The Views count, denoted by an eye, counts the total views/interactions with the corresponding activity/resource

- The Distinct users count, represented by a person icon, tallies the distinct users who have interacted with the corresponding activity/resource

In the screenshot below, Assessment 1 Instructions displays yellow. With 2 views from 1 unique user. Compare this with Q&A Forum for Assessment 1, which is displaying as orange with 24 views from 3 unique users.
Related information
- Learning analytics | L&T Hub Collection
- Acting on your learning analytics data | L&T Hub Article
- Moodle Announcements forum | L&T Hub Article

