Using Echo360 analytics in your teaching
Video is one of several ways you can present content in your subject site. When using video in your teaching, you will likely want to know more about student interactions with your videos, for example who is watching what and if there are certain parts of a video that are being rewatched.
Echo360 captures a range of data about student interactions with video content and can display visualisations and reports for individual students and whole cohorts. Data is available for all videos within your Echo360 library (media analytics), and the two focal points of this article are the video Heatmap and Media details data.
Why?
The data available on Echo360 videos in your subject site allows you to identify:
- which videos specific students have viewed
- which videos have been viewed the most
- specific parts in video(s) that are being viewed more than others
- access any notes or discussions or other Active Learning Platform interactions (if used).
The data may then help inform teaching decisions such as:
- is the video too long? Could the video be broken up into smaller, more manageable chunks?
- does the viewership drop off at a certain point each time? Have students missed key information that is covered in one of these areas?
- is high viewership of a particular section linked to student misunderstanding of the topic matter? Does something need to be clarified in a forum post?
- potential outreach to students who have no views or seemingly excessive view counts.
How?
Video Heatmap
The Video Heatmap is a visualisation of the number of views your video receives at any point in its duration. Like a line chart, the higher the line, the greater the number of views. This information is refreshed daily.
Example 1:
The image below shows the heatmap. Note there is little variation across the duration of the video. This indicates consistent viewing i.e.; students are not skipping parts of the video...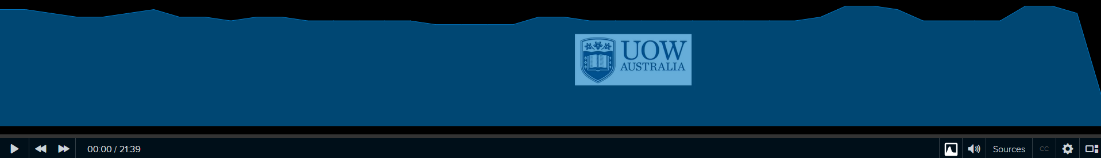
...but a closer look indicates that there are some sections of the video that have been re-watched a little more compared to the rest of the video. These sections are indicated by white arrows in the following Image.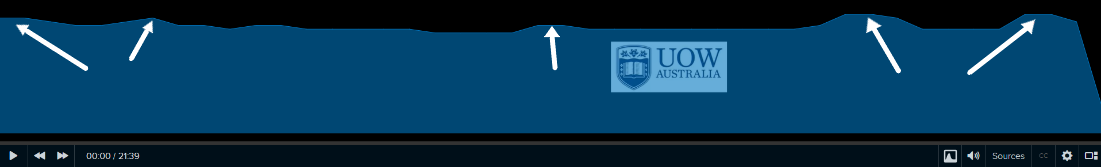
Example 2:
This second example shows a trough at the start of the video indicating this section is not being viewed as much as other parts of the video. Likewise, there is a steep drop-off in views near the end of the video: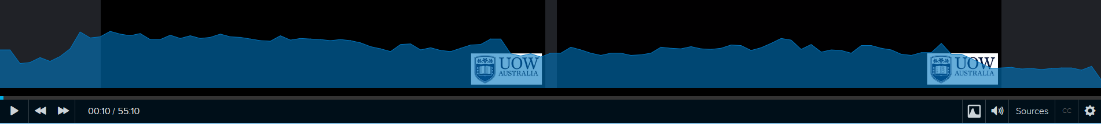
Peaks in views, indicated by white arrows in the following image, indicate parts of the video that have been re-watched.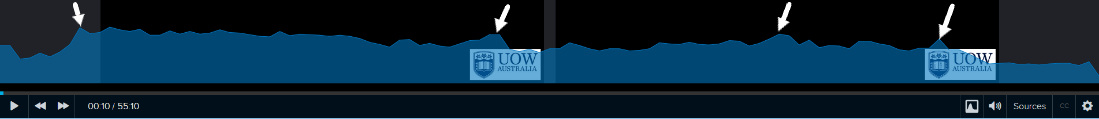
Viewing the Heatmap
To view the video Heatmap click the heatmap button on the media controls bar: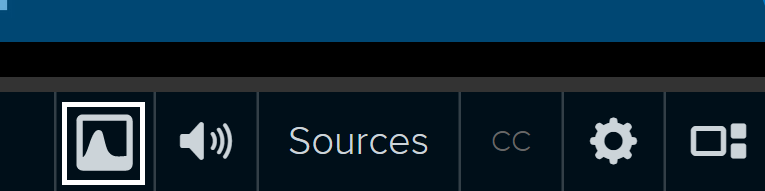
The heatmap provides us with an overall indication of students viewing of an individual video. Echo360 can also provide more specific analytics data.
Alternatively, you can drive the discussion by using statements like “Hi everyone, at 16:20 in the video I referenced…. What do you think?”
Accessing the Media Details
There are two ways to access the media details for a video
Option 1:
- From the Echo360 subject section (under the courses tab), Click the green Echo360 button and select Details from the drop-down menu.

Option 2:
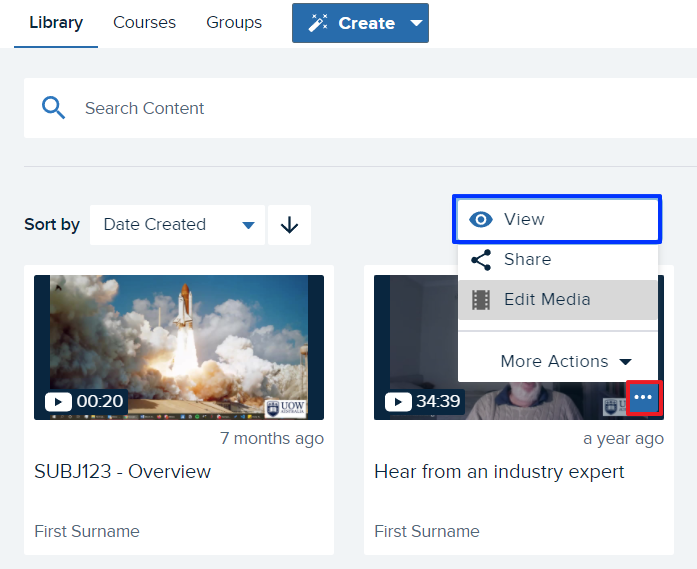
- From your Library, click the three dots icon in the lower left of the appropriate video tile, then select View.
- Click on the Analytics tab.
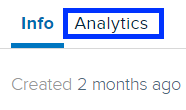
- From this tab you can view media details and the video Heatmap.
Media Details Explained
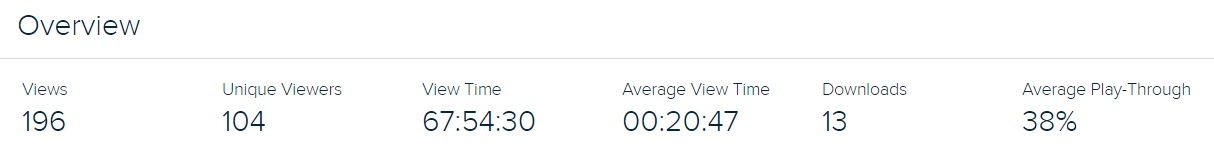
For each video in Echo360, there is a corresponding media details page. The media details page displays technical and viewership information. The media details page information is refreshed hourly.
Some of the key definitions of viewership information from Echo360:
- Views - A view is counted when a user loads the page or embedded video and presses play. If a user reloads the page and presses play again, another view is counted.
- Unique Viewers - A count of different users that have viewed the video. This only counts users who could be identified and does NOT count anonymous or public (non-authenticated) viewers.
- Average View Time - Average time spent viewing a video for each view event. This is calculated by dividing the total view time of a video by the number of views.
More detailed and additional definitions can be found on the Echo360 support page.
Related information
- View Analytics on the Media Details Page | External Resource
- Downloading Media Analytics to CSV | External Resource
If you are using Echo360 Active learning features within your videos such as polling, the below resource will also be of benefit regarding video analytics.
- Viewing Polling Responses in the Media Details Page | External Resource

